Bazel Caching Explained (pt. 2): Bazel In-Memory Cache
Bazel's architecture, Bazel's In-Memory Cache and How to measure it's impact.

I'm Son Luong Ngoc, a Solution Engineer at BuildBuddy. Previously I worked at Qarik / Booking.com / Lazada / Alibaba.
I am passionate about Developer Experience and the Reliability Culture in software development.
In Part 1 of this blog series, we have explored how Bazel works on a high level and slightly touched on some underlying data models that help speed up Bazel. With that foundation, let’s dive deeper into different caching layers inside Bazel to answer the question: What makes Bazel fast?
Author Notes
Before we start, I want to thank folks who have read and shared Part 1 of this blog series. I received a lot of feedback, many of which I tried to incorporate into the making of this Part 2.
If you have any feedbacks, questions, please feel free to leave a comment below or reach out to me via Twitter @sluongng. Your likes and shares of my articles in social media continue to be the positive signals that fuels me to create more content.
Thank you! 🙏
About this week's post
I started my Sunday wanting to write about 3 different caching layers in Bazel. However, drawing the images and crafting the demo examples for the first cache layer, In-Memory Cache, alone took me almost the entire day. 🤯
The text content turns out to be quite lengthy as well so I decided to re-title the post to make it shorter. Previous post's analytics data showed that readers seem to enjoy spending an average of 3 minutes on the post, so I want to avoid making the content too long, harder to digest. 🤔
As a result, I will only be covering the first layer today. The remaining 2 layers will be addressed in future posts of this blog series.
Please let me know if you prefer longer/shorter content! 🙇♂️
In Memory Caching
When the first Bazel command is run, Bazel treats the user’s workspace as the source of truth. As mentioned in Part 1 of this blog series, the WORKSPACE file and the BUILD files in the workspace are parsed up and create the initial shape of the Build Graph. Source files as well as external dependencies are properly resolved and their hashes are properly computed to be used as the first level of Artifacts in the graph. Bazel, then, further augments the Build Graph with environmental configurations such as OS, CPU information or user’s provided flag, to finalize a Build Graph to be executed. This whole process takes a really long time, especially if the workspace is large and/or the user-selected build target has a lot of dependencies.
Client and Server Architecture
In order to avoid paying the expensive I/O cost of re-parsing the files each time the user issues a command, Bazel stores the Build Graph in-memory of a long running process after initial startup and only updates the portions that require refresh in subsequent runs. To achieve this, Bazel divided itself into 2 parts: the Command Client written in C++ and the Command Server written in Java.
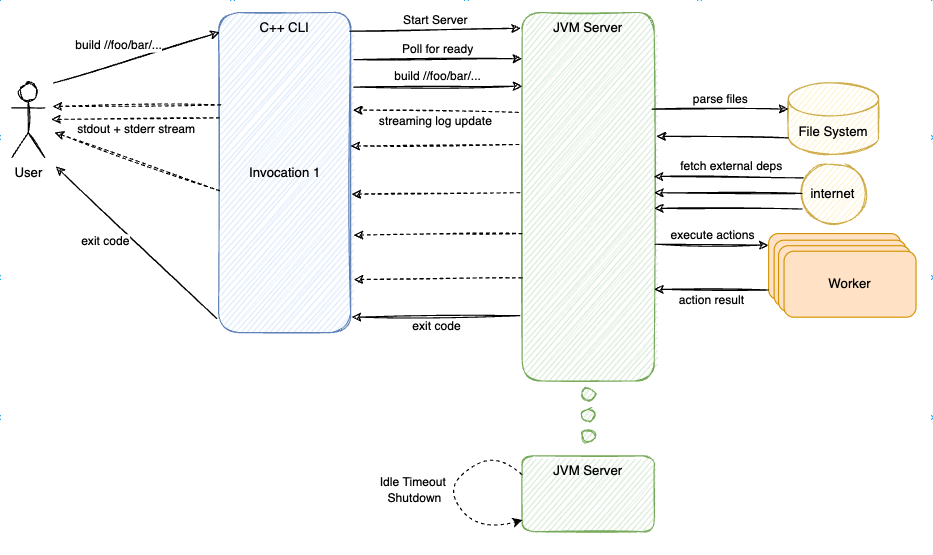
The user would interact with the Command Client directly. The Command Client, written in C++, is fast to startup. It will check whether an existing Command Server process is available to reuse. If nothing is found, it will start up a new, detached Command Server process for the current workspace.
Command Client (CLI) and Command Server(JVM Server) interact with each other via a set of gRPC encoding in Protobuf. The CLI parse user's config and flags to ensure that the Java Server was started with the correct configurations. If not, it would issue a shutdown and start a new JVM Server that matched the startup requirements. CLI will then reiterate the user's commands and flags to the server, telling the JVM Server what to build and test. Once finished, the CLI process is given the exit code from the server RPC response and exit accordingly with the given status code. The JVM is kept around in the background, holding all the Analysis Cache in-memory to reuse next time.
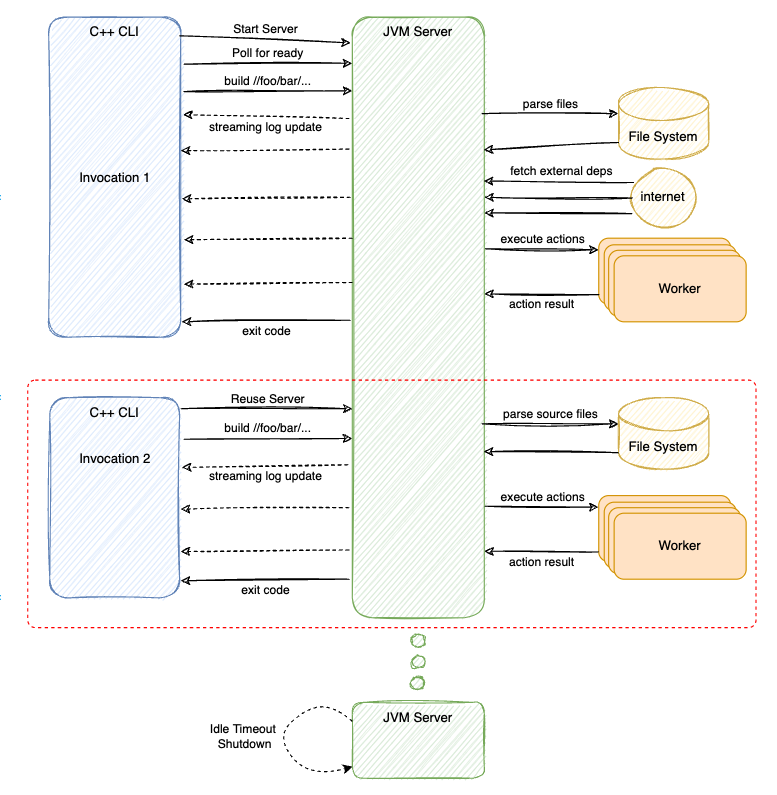
Subsequent Bazel invocation from user would re-use the previously started JVM Server process. With a "hot" Analysis Cache, Bazel JVM Server would only need to re-parse the files that was changed in the Workspace, determined by last modified time stamp of each file. This keeps the I/O workload minimal in subsequent runs.
As mentioned in Part 1, only the actions which are relevant to the changed files are queued for executions. This means most of the works in subsequent Bazel execution happen in-memory of the JVM Server process and thus, are very fast.
The "Command Center" is a common design pattern in Developer Toolings to help achieve lower latency for complex tools.
Mercurial(hg), written in Python, is shipped with a C-based CLI called
chgthat would act as the command center to help reduce the cold start of the Python interpreter.Git, the popular version control, integrates with a long running file watcher process such as
watchmanor recentSimple IPCdaemon to keepgit statusfast in a bigger repository.Terraform, the infrastructure-as-code tool from Hashicorp, relies on multiple
provider serverbackground processes to have an extensible architecture while staying fast.
Measure In-Memory Cache Impacts
But how fast is the in-memory cache really?
Good question! Good engineering could not rely on hand wavy claims alone.
Let's measure it!
Setup and Initial Run
I will be using my open source project nogo-analyzer @ d6a39583 to demonstrate this. Curious readers at home could follow these commands to try and reproduce.
> git clone https://github.com/sluongng/nogo-analyzer.git
> cd nogo-analyzer
> git checkout d6a39583
First of all, let's try to get an idea on how long it would take to build everything in this repo. Metrics are taken on an MacBook Pro M1 with 16GB of RAM and a slightly throttled SSD (thanks security agent 🤪).
> bazel build --profile=first_build.json //...
Starting local Bazel server and connecting to it...
(16:55:43) INFO: Current date is 2022-07-17
(16:56:21) INFO: Analyzed 407 targets (546 packages loaded, 14505 targets configured).
(16:56:21) INFO: Found 407 targets...
(16:58:10) INFO: Elapsed time: 148.786s, Critical Path: 78.52s
(16:58:10) INFO: 1898 processes: 390 internal, 1508 darwin-sandbox.
(16:58:10) INFO: Build completed successfully, 1898 total actions
So it took a total of 197.558 seconds to execute a fresh build. And to confirm, we do have a JVM Server running after initial build.
> ps aux | grep bazel | grep -v grep
sngoc            76186   0.0  3.8 416032864 634752   ??  Ss    4:55PM   3:43.09 bazel(nogo-analyzer) ...
The --profile= flag was used to help us better understand what's going on inside the build. You could consume the output JSON file by simply calling bazel analyze-profile like this
> bazel analyze-profile first_build.json
WARNING: This information is intended for consumption by Bazel developers only, and may change at any time. Script against it at your own risk
INFO: Profile created on Sun Jul 17 16:55:43 CEST 2022, build ID: 704743ef-d1f7-4eb5-9bb0-2b3e262b6a56, output base: /private/var/tmp/_bazel_sngoc/44e60f02b0f0d351d37480700dec3dcb

=== PHASE SUMMARY INFORMATION ===

Total launch phase time         1.212 s    0.81%
Total init phase time           0.268 s    0.18%
Total target pattern evaluation phase time    4.427 s    2.97%
Total interleaved loading-and-analysis phase time   33.657 s   22.61%
Total preparation phase time    0.052 s    0.03%
Total execution phase time    109.166 s   73.33%
Total finish phase time         0.082 s    0.06%
------------------------------------------------
Total run time                148.866 s  100.00%

Critical path (78.518 s):
       Time Percentage   Description
     604 ms    0.77%   action 'GoToolchainBinaryCompile external/go_sdk/builder.a [for host]'
     613 ms    0.78%   action 'GoToolchainBinary external/go_sdk/builder [for host]'
     833 ms    1.06%   action 'GoCompilePkg external/org_golang_x_tools/cmd/goyacc/goyacc.a [for host]'
     657 ms    0.84%   action 'GoLink external/org_golang_x_tools/cmd/goyacc/goyacc_/goyacc [for host]'
    0.06 ms    0.00%   runfiles for @org_golang_x_tools//cmd/goyacc goyacc
    1.698 s    2.16%   action 'Action external/com_github_bazelbuild_buildtools/build/parse.y.baz.go [for host]'
     788 ms    1.00%   action 'GoCompilePkg external/com_github_bazelbuild_buildtools/build/go_default_library.a [for host]'
     606 ms    0.77%   action 'GoCompilePkg external/bazel_gazelle/rule/rule.a [for host]'
     649 ms    0.83%   action 'GoCompilePkg external/bazel_gazelle/repo/repo.a [for host]'
     604 ms    0.77%   action 'GoCompilePkg external/bazel_gazelle/resolve/resolve.a [for host]'
     475 ms    0.61%   action 'GoCompilePkg external/bazel_gazelle/language/language.a [for host]'
   20.898 s   26.62%   action 'GoCompilePkg external/bazel_gazelle/language/proto/proto.a [for host]'
     992 ms    1.26%   action 'GoCompilePkg external/bazel_gazelle/language/go/go.a [for host]'
     862 ms    1.10%   action 'GoCompilePkg external/bazel_gazelle/cmd/gazelle/gazelle.a [for host]'
    1.575 s    2.01%   action 'GoLink external/bazel_gazelle/cmd/gazelle/gazelle_/gazelle [for host]'
    0.05 ms    0.00%   runfiles for @bazel_gazelle//cmd/gazelle gazelle
   46.487 s   59.21%   action 'Executing genrule //golangci-lint gen_deps [for host]'
     174 ms    0.22%   action 'Executing genrule //golangci-lint write_deps'
Neat! What did we learn?
Bazel build is broken down into multiple phases in a particular order.
+----------------------------------+--------------+
| Phases                           | First Build  |
+----------------------------------+--------------+
| Launch                           |      1.212 s |
| Init                             |      0.268 s |
| Target Pattern Evaluation        |      4.427 s |
| Interleaved loading-and-analysis |     33.657 s |
| Preparation                      |      0.052 s |
| Execution                        |    109.166 s |
| Finish                           |      0.082 s |
+----------------------------------+--------------+
| Total                            |    148.866 s |
+----------------------------------+--------------+
The 2 phases:
loading-and-analysisandexecutionseem to be where Bazel spends the most time. More on this later.Bazel provides to us some handy
Critical Pathsuggestions out of the box to help identify slow actions. NEAT!
In-memory cache impact
But we are here to measure how slow Bazel is without the in-memory cache, so let's shutdown Bazel and force it to re-run without the in-memory cache.
# Check for Bazel JVM server process still alive
> ps aux | grep bazel | grep -v grep | wc -l
       1

# Tell it to shutdown
> bazel shutdown

# Make sure it's down for good
> ps aux | grep bazel | grep -v grep | wc -l
       0
Then let's trigger the build again, this time without in-memory cache.
> bazel build --profile=second_build.json //...
Starting local Bazel server and connecting to it...
(17:12:10) INFO: Current date is 2022-07-17
(17:12:23) INFO: Analyzed 407 targets (546 packages loaded, 14505 targets configured).
(17:12:23) INFO: Found 407 targets...
(17:12:40) INFO: Elapsed time: 31.619s, Critical Path: 3.75s
(17:12:40) INFO: 1 process: 1 internal.
(17:12:40) INFO: Build completed successfully, 1 total action

> bazel analyze-profile second_build.json
WARNING: This information is intended for consumption by Bazel developers only, and may change at any time. Script against it at your own risk
INFO: Profile created on Sun Jul 17 17:12:10 CEST 2022, build ID: db33a3ad-2eca-4ffb-ba20-ea0ef401b1a8, output base: /private/var/tmp/_bazel_sngoc/44e60f02b0f0d351d37480700dec3dcb

=== PHASE SUMMARY INFORMATION ===

Total launch phase time         1.251 s    3.95%
Total init phase time           0.239 s    0.75%
Total target pattern evaluation phase time    0.948 s    2.99%
Total interleaved loading-and-analysis phase time   12.412 s   39.20%
Total preparation phase time    1.011 s    3.20%
Total execution phase time     15.755 s   49.75%
Total finish phase time         0.048 s    0.15%
------------------------------------------------
Total run time                 31.666 s  100.00%
But it's not fair to compare this result to the first build as some of the local caching might be interfering with our result (more on this later). So let's do a third build, this time with the in-memory cache in place.
> bazel build --profile=third_build.json //...
(17:15:45) INFO: Current date is 2022-07-17
(17:15:45) INFO: Analyzed 407 targets (0 packages loaded, 0 targets configured).
(17:15:45) INFO: Found 407 targets...
(17:15:45) INFO: Elapsed time: 0.382s, Critical Path: 0.01s
(17:15:45) INFO: 1 process: 1 internal.
(17:15:45) INFO: Build completed successfully, 1 total action

> bazel analyze-profile third_build.json
WARNING: This information is intended for consumption by Bazel developers only, and may change at any time. Script against it at your own risk
INFO: Profile created on Sun Jul 17 17:15:45 CEST 2022, build ID: 2a0a8d3b-57b7-4e5c-a758-8c8ea8a8ed4f, output base: /private/var/tmp/_bazel_sngoc/44e60f02b0f0d351d37480700dec3dcb

=== PHASE SUMMARY INFORMATION ===

Total launch phase time         0.130 s   32.89%
Total init phase time           0.100 s   25.46%
Total target pattern evaluation phase time    0.006 s    1.75%
Total interleaved loading-and-analysis phase time    0.040 s   10.19%
Total preparation phase time    0.072 s   18.39%
Total execution phase time      0.032 s    8.14%
Total finish phase time         0.012 s    3.18%
------------------------------------------------
Total run time                  0.395 s  100.00%
Let's put the results back together.
+----------------------------------+---------------------------+------------------------+
| Phases                           |              Second Build |            Third Build |
|                                  | (without in-memory cache) | (with in-memory cache) |
+----------------------------------+---------------------------+------------------------+
| Launch                           |                   1.251 s |                0.130 s |
| Init                             |                   0.239 s |                0.100 s |
| Target Pattern Evaluation        |                   0.948 s |                0.006 s |
| Interleaved loading-and-analysis |                  12.412 s |                0.040 s |
| Preparation                      |                   1.011 s |                0.072 s |
| Execution                        |                  15.755 s |                0.032 s |
| Finish                           |                   0.048 s |                0.012 s |
+----------------------------------+---------------------------+------------------------+
| Total                            |                  31.666 s |                0.395 s |
+----------------------------------+---------------------------+------------------------+
Observations:
In the second run, without in-memory cache, we can see that the 2 phases
loading-and-analysisandexecutionwould have a variabled run duration, most likely to be scaling based on the size of the repository. In the third run, with in-memory cache, these 2 phases seem to have closer to constant run duration.By re-using the JVM server process, all other phases were sped up! Even by not a lot, the total amount of time saved could be up to a few seconds which help improve the user experience on the command line.
Going from
31.7 secondsdown to0.395 secondis VERY significant!
Bazel Profile Introduction
These are just observations, it's not scientific! How do we tell for sure?
Fine, let's dive deeper!
Another way to consume the Bazel profile json file is to visualize them using chrome://tracing view, or to use https://ui.perfetto.dev/ trace viewer. These JSON files are written in Chrome's Trace Event Format and therefore, could be consumed and analyzed by various tools.
For example, here is the trace profile for our first build.
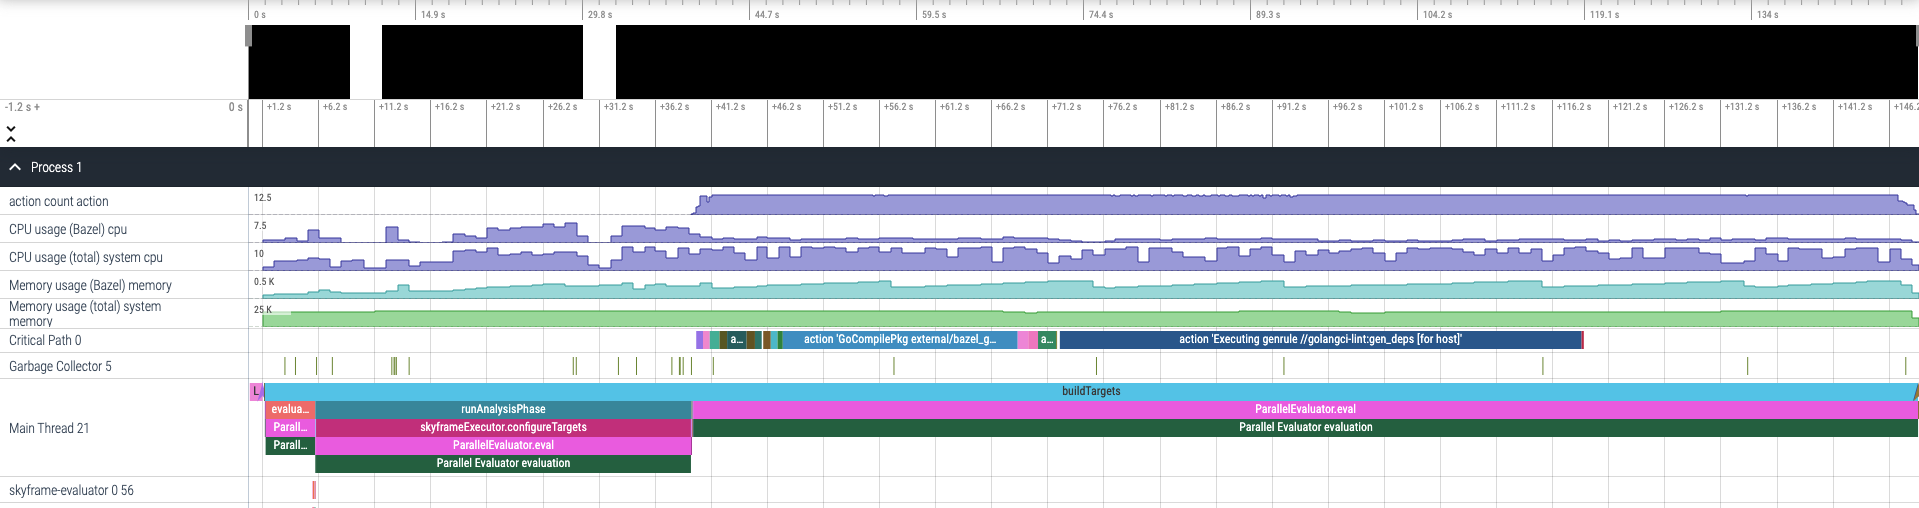
Up top, you could see that the total duration of the build was 148 seconds. Scrolling down a bit more to the bottom, we can see in detail how these 148 seconds was spent.
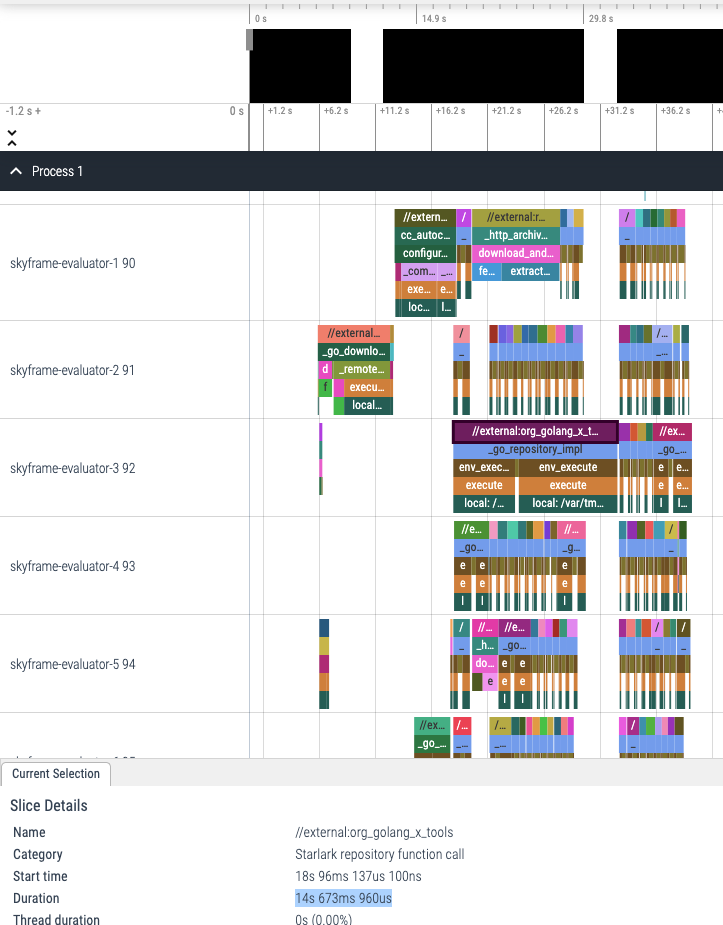
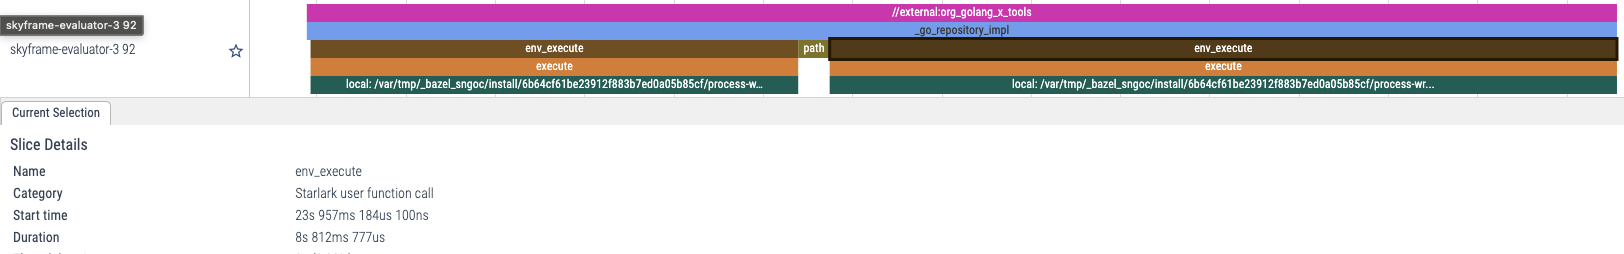
Here is the first ~40 seconds which, according to our profile summary earlier, was spent on the loading-and-analysis phase. Using this trace viewer, we could see in detail what action was executed during this phase of the build and how long did it take to run that action. For example, in the screenshot above, we could see that //external:org_golang_x_tools run took 14.6 seconds in total. In which, most of the time was spent in the _go_repository_impl Starlark function call. Zooming a bit into it, we can see that there are 3 sub paths under _go_repository_impl: two env_execute and one path.
Zooming out and scrolling a bit further down, we can see when the loading-and-analysis phase ended and the execution phase picked up.
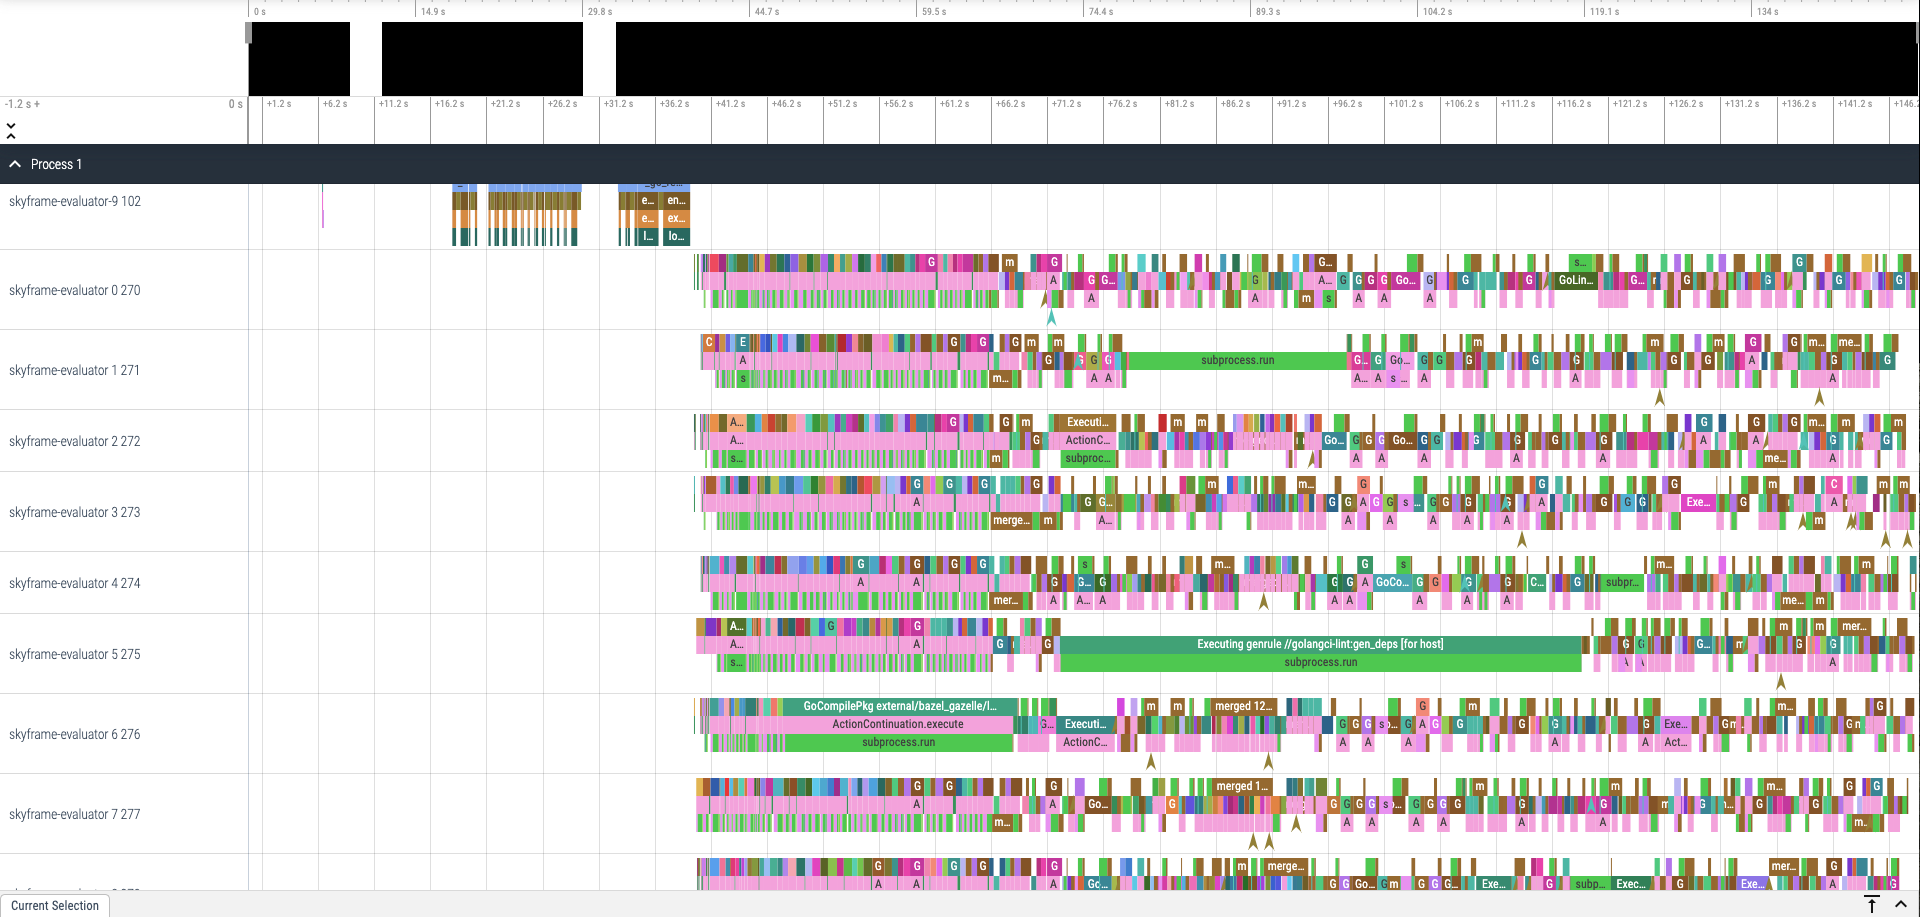
Examining actions of the execution phase a bit closer, we can see our familiar compile and link actions happening in close details:
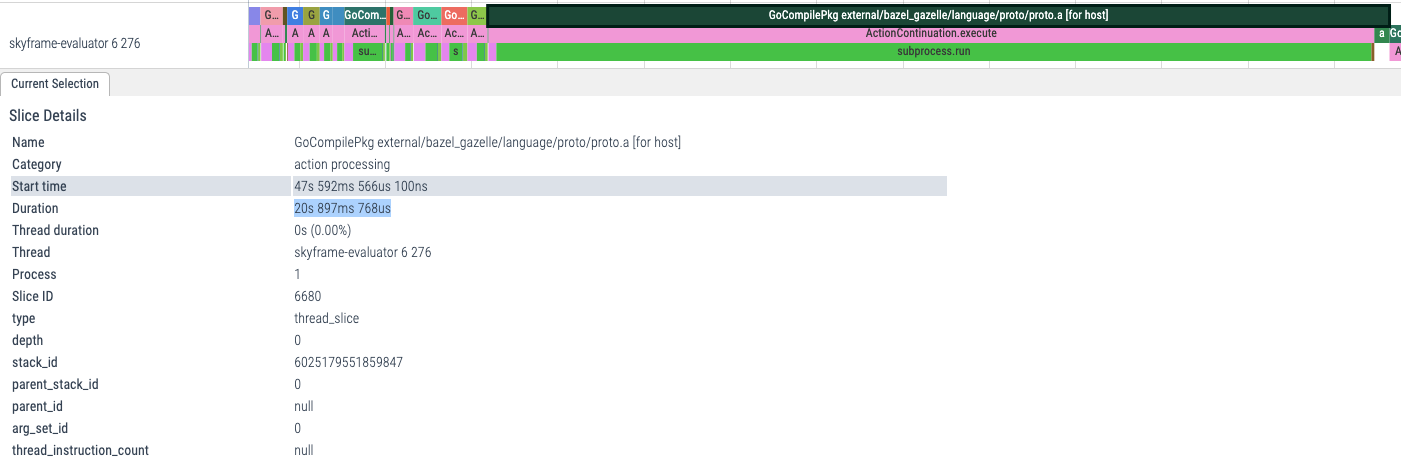
Above, we can see that GoCompilePkg external/bazel_gazelle/language/proto/proto.a actions took 20s 897ms in total to compile Gazelle's language/proto package.
🥸 Remember this result, we will use it later!
Bazel Profiling is cool eh? 😎
Profiling In-Memory Cache
Ok I get it. Just show me the caching results already!
Alright! Alright!
Let's recall ages ago that we had 2 builds: one without in-memory cache that took 30 seconds and one with memory cache that took 0.4 seconds.
Here is how the build without in-memory cache:
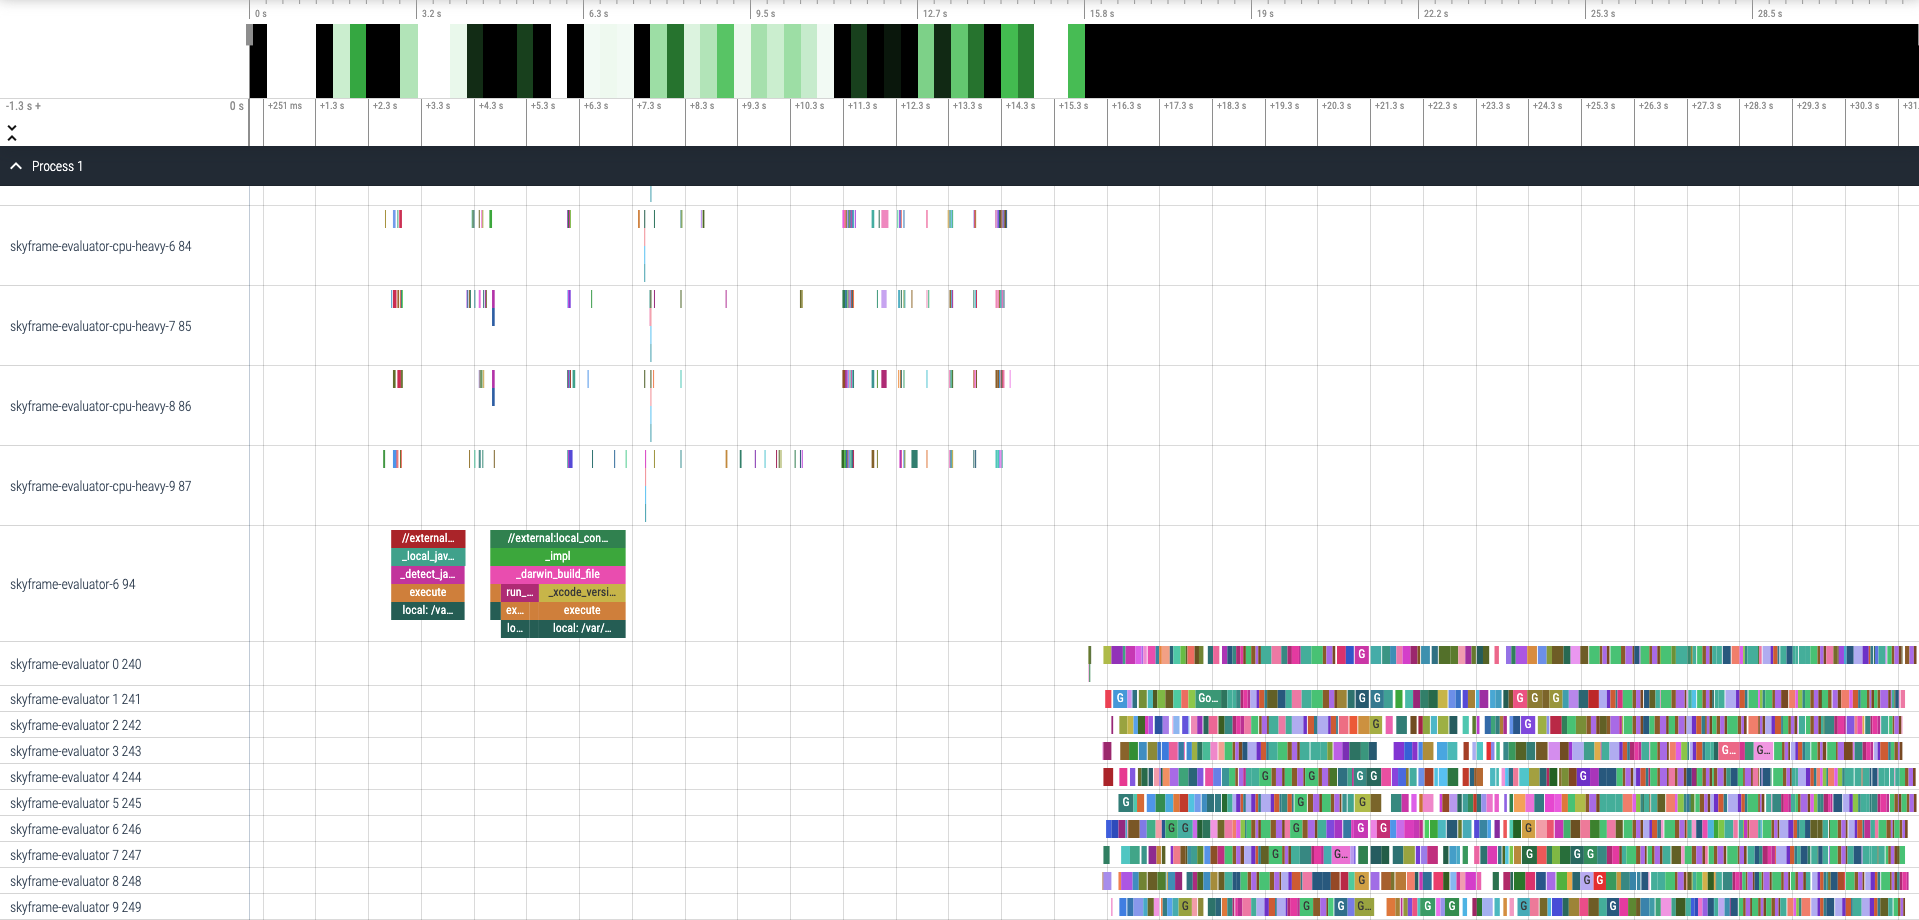
and here is the build with in-memory cache:
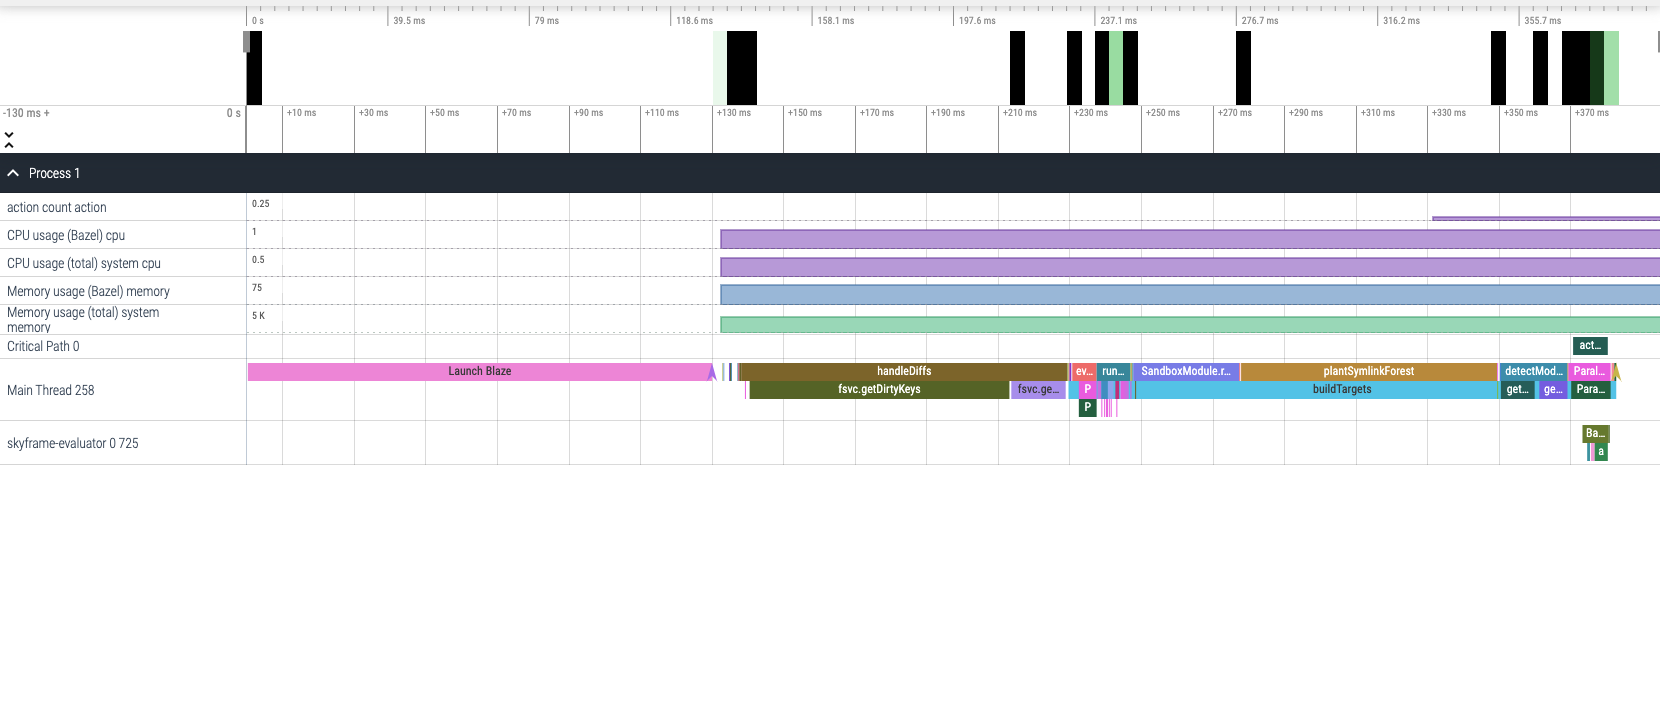
The difference is quite subtle isn't it?
First let's note that the total duration of these 2 builds are different. In reality, the entire span of the third run above is 0.4 seconds, which is slightly more than 1/100 of the second run's duration, 31.6 seconds.
Secondly, what with all the actions happening in the run without in-memory cache?
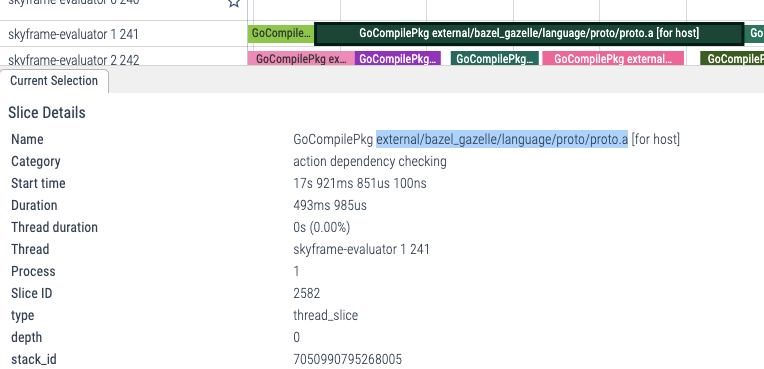
By zooming into these profiles, we can see that although their labels are the same with the actions happening in the fresh build, they don't have a similar execution stack. GoCompilePkg external/bazel_gazelle/language/proto/proto.a in this run, instead of taking more than 20 seconds, only take 493 milliseconds. Actions here are mostly in the category of action dependency checking and the actual actions are not executed, only the Action Cache(AC) checks are.
This is because these actions' results are already cached on-disk from the previous run. Recalling our lesson from Part 1 of this series, when Bazel started up and ran the second time, it only needed to re-hash the existing inputs and check whether the action had already been cached from the previous run to re-use its outputs.
All these hashing and action dependency checking results are then kept within the JVM Server's memory and thus, on the third run, Bazel simply does not need to do anything. These, together, make up the large part of what we often refer to as the Bazel's Analysis Cache, or as we have been calling it since Part 1, the Build Graph. Shutting down the JVM Server would discard these results from memory. On the next run when the JVM Server has to startup fresh, Bazel needs to fall back to the files on-disk (files in your workspace and CAS and AC) as the source of truth and re-do the parse -> hash -> check dance over again to reconstruct the Build Graph.
Other Optimizations
In reality, Bazel keeps more than just the Build Graph within the JVM's memory.
For example, depends on your Bazel's setup, there could be a Merkle Tree Cache being kept in place to help marking known node in inputs file-tree. This helps speed up the tree traversal when Bazel interacts with Remote Cache and/or Remote Build Execution services.
Another benefit of having a long lived Bazel JVM Server is that it could also be configured with --watchfs. It enables the JVM Server to subscribe to the supported File System's Events and get notified when files are updated. This helps reduce the file walking Bazel needs to do to the entire workspace's directory tree to find modified files, help save a lot of costly disk I/O.
Advanced users might find flags such as host_jvm_args very useful to fine tune the JVM server. There are flags such as max_idle_secs to tell Bazel how long to keep an idle JVM server around for before shutting it down, or idle_server_tasks to allow JVM Server to run Garbage Collection during idle time. There are also hidden flags such as cache_computed_file_digests that would let users fine tune how much cache to keep inside Bazel's JVM.
Conclusion
Today, we learned about:
Bazel's Client - Server Architecture
Bazel's In-Memory Cache
Use Bazel's Profiling to measure In-Memory Cache's impact on builds.
In my experience, between the 3 caching layers of Bazel, In-Memory Cache is the easiest one to miss. It's not common for CI Service Providers to be offering an in-memory caching system, especially when local disk cache and / or remote cache could already speed your CI Pipelines in the open source ecosystem down to merely a minute. Therefore, engineers don't often think that they need in-memory cache in CI, just because most existing solutions in the wild don't offer one. However, in the enterprise monorepo context, in-memory cache sometimes is the only way to keep things reasonable. It is applied everywhere: in production services, in Data / ML Pipelines, etc... and now, CI builds.
In real world scenarios, I have observed cases where keeping a warm Bazel JVM Server in CI could save 10s of minutes of total build time. It helped reduce incremental build time, from growing linearly with the size of the repository, to small variable time based on the change submitted. As a consequence, total build time was reduced to sub five minutes, sometimes even sub one minutes, even for larger repositories with hundreds of thousands to millions of commits.
However, keeping a warm JVM Server in CI comes with a cost: your CI worker needs to be stateful, long lived. Smaller organizations, which lack of dedicated engineering resources to maintain CI's health, switching from ephemeral CI workers to stateful ones came with significant costs:
Dedicated infrastructure for Bazel workers
Custom monitoring and alerting
Tight control of CI processes to eliminate unwanted side-effects, left over states
These costs, however, are often offset by the overall increase in developer productivity thanks to faster overall build time. Build running faster also means fewer CI workers needed overall thus a reduction in the overall infrastructure cost may also be observed. Autoscaling and ephemeral can still be achieved by building a "worker vending machine" orchestration pattern with a set of stand-by warm workers, just enough capacity to buy you time to spin up and warm up the next batch of workers. Fortunately, CI workload are often predictable and even a simple schedule-based scaling solution could be quite cost effective.
Organizations with dedicated engineering resources may be interested in some of the recent advancement with FireCracker microVM, the power behind AWS Lambda. FireCracker microVM could be "paused" and the VM's memory could be saved onto disk as snapshots and cloned into multiple microVMs. These snapshots could be started up within milliseconds, if not microseconds 🔥, with the full application's memory and states preserved. This makes FireCracker microVMs incredibly suitable as a packaging medium for Bazel's In-Memory Cache.
I want to leave you today with a key takeaway: similar to all optimization in Software Engineering, Bazel's build optimizations should be driven with metrics. Bazel is equipped with a matured architecture and profiling capability that enables you to dissect, pinpoint slowness that not many other tools in the same category could compete with. We can leverage that to gain better insight into our builds and make it Blaze-ingly fast 💪


